I am in the process of moving this week and of course it’s chaos - selling things on Facebook Marketplace, panic ordering stuff on Amazon, and trying to figure out if my couch will fit through the doorway. In the interest of my sanity, I’m pulling one of my favorite pieces from a few years ago from the archives to repost today. My move is just within Brookyln - from Williamsburg to Cobble Hill. If you’re in the area or have good recommendations hit me up!
I initially created this as a workshop I led with colleagues at Pandora Jewelry. I was on the strategy team and created sales reporting that broke out our retail performance using this framework. I then introduced this framework across the company as a standard way of evaluating retail performance, so we could all share a common language. My goal was to keep it super simple, so even the less math-inclined (and I count myself in this group) could gain a deep understanding of the concepts. I still find this super helpful in my current role. Even the most technical, complicated-seeming digital marketing tactics can be boiled down to fundamental retail levers. This one is a little dorky, I but I know you guys are too!
I hope you enjoy!
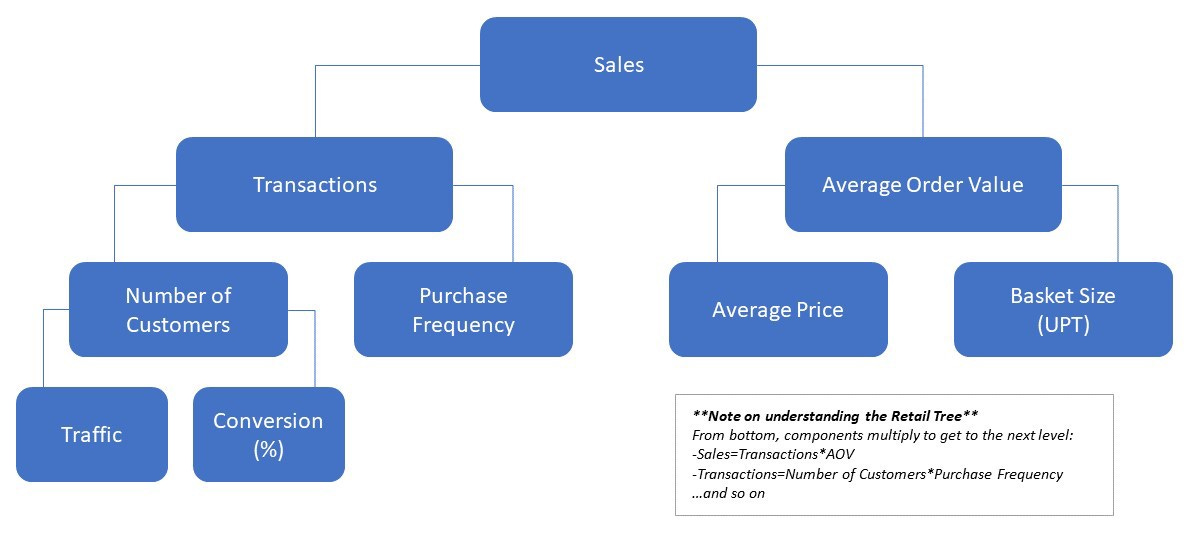
Introducing: The Retail Tree.
The goal of the Retail Tree is to decompose sales into its most basic parts, allowing you to zero in on specific tactics that you can use to grow your business.
If you sell anything to a customer, you should understand these metrics and how they work.
Let’s dive in.
Let’s start at the top of the tree with Sales. I’m not claiming to be an economics whiz, but I passed the class and do remember one equation from the first day:
Revenue=Price*Quantity
Taking this universal truth and translating it into “retail speak”:
Sales=Average Order Value (Price)*Transactions (Quantity of Sales)
There are two ways to increase your sales. You can:
a. Make more sales (increase number of Transactions) AND/OR
b. Get more money per sale (increase average order value, or AOV)
This isn’t very helpful. “Make more sales” sounds great but isn’t actionable. We need to dive deeper into the framework.
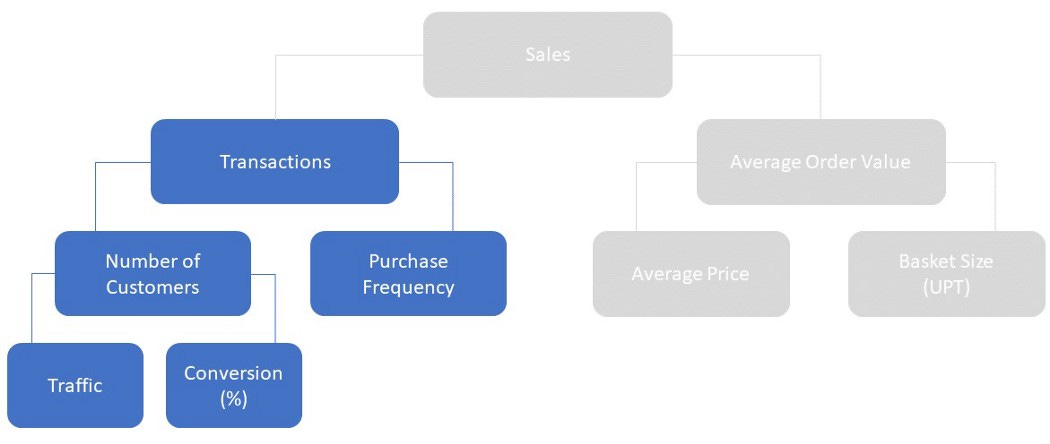
Part A: Increase Transactions
Transactions=Number of customers*Purchase Frequency
Number of customers
One way to make more sales is to sell to more people. Awesome, let’s do it. How do you get customers? First, you need to get in front of an audience. Then, you need to convert people in that audience into buyers:
Number of customers=Traffic*Conversion Rate
This bring us to the root of the Retail Tree. Welcome! Now that we’re here, we are much better positioned to think tactically about ways to drive our business:
Traffic drivers (illustrative examples):
-Hold events in your store to draw people in
-Put ads in the neighborhood to tell people about your store
-Work with influencers in your subject area link to your site in their content or talk about your store
-Pay for Google ads to get people to click through to your site
-Improve online organic traffic through SEO
Conversion drivers (illustrative examples):
-Train store associates to recommend relevant products to customers
-Set up your store so customers can interact with the products and connect with them
-Invest in detailed and visually appealing product pages on your site that answer customer questions about the product (e.g. sizing, usage)
-Offer financing options to reduce upfront barrier to purchase
Purchase Frequency
The other side of the “transactions” branch is purchase frequency. How often does the customer buy? It is typically much easier and cheaper to get a returning customer to buy from you again than to convert a new customer. Brands will do everything they can to push one-time buyers toward their second sale (and beyond). So, we want customers to buy more often (duh!). But how? Here are some strategies you have probably seen in action:
Subscription models: I recently signed up for a free month trial with Classpass, anticipating canceling after a month or two. Now I’m hooked. By dangling the carrot of one “free” month, I have ended up buying 6+ months — and am now a loyal customer. While subscription models aren’t as “hot” as they were during the Birchbox era, they aren’t going away.
Loyalty programs: These programs are engineered to drive more frequent purchases (and can also target other Retail Tree metrics, like Basket Size and Average Selling Price, which we will discuss later). One of the best loyalty programs is Sephora’s VIB program, which uses a tiered rewards system to keep customers coming back.
Offers to drive repeat purchase: I recently tried a new DTC beverage brand and got an email when I was nearing the end of my supply. The email offered $10 off my next purchase, which prompted me to try another flavor.
Planned obsolescence and seasonality: These tactics are so common we don’t even notice them. I remember saving up to buy a pair of Airpods only to see a newer model released a few months later. This encouraged me to replace my pair with the “latest and greatest.” This is called planned obsolescence - when companies intentionally make their products obsolete so you’ll buy something new. Another strategy is how brands take advantage of seasonality and the trend cycle to encourage consumption. This is one reason why the average American throws away 80 pounds of clothes per year (but that’s the topic of another article!)
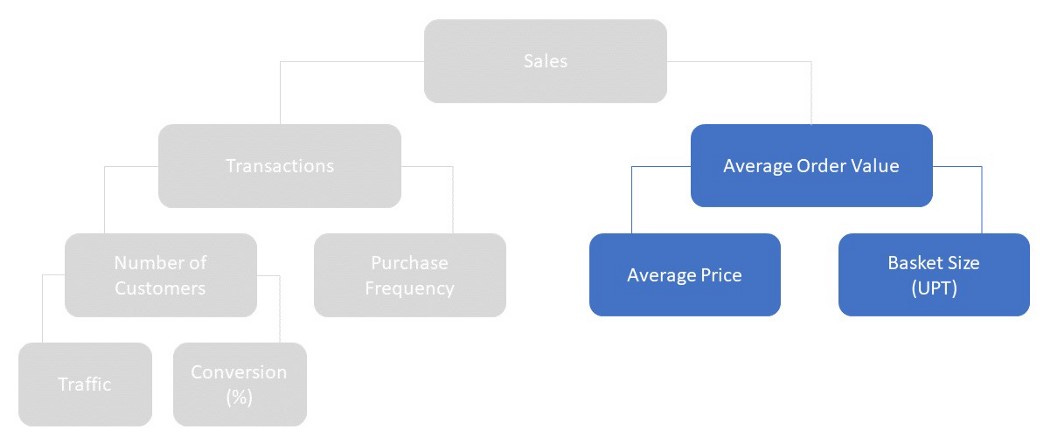
Part B: Increase Average Order Value
Average Order Value=Average Price*Basket Size
On this side of the tree, we want people to spend more money when they shop with you — buying more, expensive items at with fewer discounts each time they shop.
Average selling price
Average selling price (ASP) is the average price of the goods you sell to the customer. We also refer to this as Average Order Value (AOV). Here are some ways you can keep ASP high:
Upsell: Upselling is getting your customer to buy a more expensive version of your product. For example, when I was a barista at Starbucks in college, I would ask customers if they wanted an extra shot in their drink. My VIP customer would visit daily and order 8 shots of espresso on ice - an expensive and memorable drink that drove our AOV higher.
Limit promotions: A major way retailers increase sales in a hurry is by slashing prices. ASP is the main metric affected by this. Maintaining integrity of full-priced sales whenever possible is the best way to preserve ASP.
Add higher-priced items to your product mix: This is a longer-term strategy for most brands. As you increase the products you offer, keep an eye on the average price points, as this will impact ASP and AOV. Related to this, brands can bundle existing products together to increase ASP - for example, creating a matching set SKU with a shirt and pants that go together and allowing customer to add both to their bag at once.
It’s also worth asking whether you can raise your price, especially when you are first starting out.
Basket Size
Basket size (otherwise known as units per transaction, or UPT) comes from the traditional retail concept of trying to get customers to check out with more items in their shopping basket. The classic example of this is the gum and magazines you see in the checkout aisle of the grocery store, known as “impulse purchases.”
Cross-selling: Cross-selling is offering your customer a different, but perhaps related, product. Amazon has attributed over 35% of its sales to cross-selling, via the “Recommendations for You” section at the bottom of the page. As a Starbucks barista, I was required to ask all customers if they wanted a pastry with their coffee. This is a classic cross-selling strategy.
Add-on items: Similar to impulse purchases in the grocery store, many online retailers are offering add-on items to increase basket size. Shoe companies may offer socks; candle brands may branch into wick cutters and matchbooks.
How to Use the Retail Tree Framework
Know your data
Learn which of these drivers are weak and which are strong for your business. You can compare against historical trends and against competitors. This can help you figure out where to focus your efforts. In one of my previous companies, we found that we were really good at converting people shopping for gifts, but less good at converting people shopping for themselves. This helped us learn to (A) increase traffic of gift shoppers through targeted campaigns to drive traffic to our site around holidays and (B) learn more about self-purchase shoppers to get better at converting them.
Understand the tradeoffs
Driving one lever can (and probably will) reduce performance on others. For instance, if you add inexpensive add-on items to your site, you will see a drop in ASP, but may increase basket size and conversion. Use the tree framework to model out what that means for your total sales.
Test, measure, and learn
You can use this framework to create hypotheses about your business and then go out and test them. For instance, in my women’s clothes company I saw that people were visiting my site and not buying as often as I expected. I suspected it was because my site needed more detailed information on sizing and fit. I experimented with a more detailed sizing chart and saw some improvement in my key metric, conversion. Based on these early results, I feel more comfortable making larger investments in my site.
Observe what your favorite brands are doing
Once you start thinking about the Retail Tree, each e-mail you receive from a brand, every subway ad, and every new product launch is a clue into their strategy.
I hope you enjoyed this tutorial on the most significant Retail KPIs and how they are related. Thanks for reading!
Stay Curious,
Melina


Coffee shops are so good at upselling I’ve ended up with a $10 latte before 🤣